Grafana, InfluxDB and Python, simple sample
I recently came across an interesting contract position which uses Grafana and InfluxDB. I’d had a play with ElasticSearch before, and done some work with KairosDB, so was already familiar with time series and json-based database connections. Having manually created a dashboard, Grafana looked rather interesting. So I thought I’d do a quick trial – generate some random data, store it in InfluxDB and show it with Grafana
Starting with a clean virtual machine:
InfluxDB
- Set up InfluxDB
- I followed InfluxDB’s installation instructions, which worked first time without any problems
- Start it
sudo /etc/init.d/influxdb start
- Test InfluxDB
influx
> create database mydb
> show databases
name: databases
---------------
name
_internal
mydb

> use mydb
> INSERT cpu,host=serverA,region=us_west value=0.64
> SELECT host, region, value FROM cpu
name: cpu
---------
time            host    region  value
1466603916401121705 serverA us_west 0.64
- Set up and test influxdb-python, so we can access InfluxDB using Python
sudo apt-get install python-pip
pip install influxdb
python
>>> import influxdb
>>>
- Run through this example of writing and reading some InfluxDB data using Python
>>> from influxdb import InfluxDBClient >>> json_body = [ ... { ... "measurement": "cpu_load_short", ... "tags": { ... "host": "server01", ... "region": "us-west" ... }, ... "time": "2009-11-10T23:00:00Z", ... "fields": { ... "value": 0.64 ... } ... } ... ] >>> client = InfluxDBClient('localhost', 8086, 'root', 'root', 'example') >>> client.switch_database('mydb') >>> client.write_points(json_body) True >>> print client.query('select value from cpu_load_short;') ResultSet({'(u'cpu_load_short', None)': [{u'value': 0.64, u'time': u'2009-11-10T23:00:00Z'}]}) - Create some more data, using a slimmed down version of this tutorial script
import argparse from influxdb import InfluxDBClient from influxdb.client import InfluxDBClientError import datetime import random import time USER = 'root' PASSWORD = 'root' DBNAME = 'mydb' def main(): host='localhost' port=8086 nb_day = 15 # number of day to generate time series timeinterval_min = 5 # create an event every x minutes total_minutes = 1440 * nb_day total_records = int(total_minutes / timeinterval_min) now = datetime.datetime.today() metric = "server_data.cpu_idle" series = [] for i in range(0, total_records): past_date = now - datetime.timedelta(minutes=i * timeinterval_min) value = random.randint(0, 200) hostName = "server-{d34bf16ac7b745ad0d2811187511ec8954163ba9b5dbe9639d7e21cc4b3adbdb}d" {d34bf16ac7b745ad0d2811187511ec8954163ba9b5dbe9639d7e21cc4b3adbdb} random.randint(1, 5) # pointValues = [int(past_date.strftime('{d34bf16ac7b745ad0d2811187511ec8954163ba9b5dbe9639d7e21cc4b3adbdb}s')), value, hostName] pointValues = { "time": past_date.strftime ("{d34bf16ac7b745ad0d2811187511ec8954163ba9b5dbe9639d7e21cc4b3adbdb}Y-{d34bf16ac7b745ad0d2811187511ec8954163ba9b5dbe9639d7e21cc4b3adbdb}m-{d34bf16ac7b745ad0d2811187511ec8954163ba9b5dbe9639d7e21cc4b3adbdb}d {d34bf16ac7b745ad0d2811187511ec8954163ba9b5dbe9639d7e21cc4b3adbdb}H:{d34bf16ac7b745ad0d2811187511ec8954163ba9b5dbe9639d7e21cc4b3adbdb}M:{d34bf16ac7b745ad0d2811187511ec8954163ba9b5dbe9639d7e21cc4b3adbdb}S"), # "time": int(past_date.strftime('{d34bf16ac7b745ad0d2811187511ec8954163ba9b5dbe9639d7e21cc4b3adbdb}s')), "measurement": metric, 'fields': { 'value': value, }, 'tags': { "hostName": hostName, }, } series.append(pointValues) print(series) client = InfluxDBClient(host, port, USER, PASSWORD, DBNAME) print("Create a retention policy") retention_policy = 'awesome_policy' client.create_retention_policy(retention_policy, '3d', 3, default=True) print("Write points #: {0}".format(total_records)) client.write_points(series, retention_policy=retention_policy) time.sleep(2) query = 'SELECT MEAN(value) FROM "{d34bf16ac7b745ad0d2811187511ec8954163ba9b5dbe9639d7e21cc4b3adbdb}s" WHERE time > now() - 10d GROUP BY time(500m);' {d34bf16ac7b745ad0d2811187511ec8954163ba9b5dbe9639d7e21cc4b3adbdb} (metric) result = client.query(query, database=DBNAME) print (result) print("Result: {0}".format(result)) if __name__ == '__main__': main() - Save as create_sample_data.py, run and test it
python create_sample_data.py
......
influx
Visit https://enterprise.influxdata.com to register for updates, InfluxDB server management, and monitoring.
Connected to http://localhost:8086 version 0.13.0
InfluxDB shell version: 0.13.0
> use database mydb
> SELECT MEAN(value) FROM "server_data.cpu_idle" WHERE time > now() - 10d GROUP BY time(500m)
time			mean
1466280000000000000	94.03846153846153
1466310000000000000	98.47
1466340000000000000	95.43
1466370000000000000	104.3
1466400000000000000	104.01
1466430000000000000	114.18
1466460000000000000	106.19
1466490000000000000	96.67
1466520000000000000	107.77
1466550000000000000	103.08
1466580000000000000	100.53
1466610000000000000	94
Grafana
- Install Grafana using the installation instructions:
$ wget https://grafanarel.s3.amazonaws.com/builds/grafana_3.0.4-1464167696_amd64.deb
$ sudo apt-get install -y adduser libfontconfig
$ sudo dpkg -i grafana_3.0.4-1464167696_amd64.deb
- Start the server and automatically start the server on boot up
sudo service grafana-server start
sudo systemctl enable grafana-server.service
- Test
- In your browser, go to localhost:3000
- Log in as (user) admin, (password) admin
- Connect to the InfluxDB database
- I followed the Instructions at http://docs.grafana.org/datasources/influxdb/
- Click on the Grafana icon
- Select “Data Sources”
- Click on “+ Add data source”
- Name: demo data
- Type: InfluxDB
- URL: http://localhost:8086
- Database: mydb
- User: root
- Password: root
- Click on “Save and Test”
- Create a new Dashboard
- Click on the Grafana icon
- Select “Dashboards”
- Click on “New”
- Define a metric (graph)
- Click on the row menu, i.e. the green icon (vertical bar) to the left of the row
- Select “Add Panel”
- Select “Graph”
- On the Metrics tab (selected by default)
- Click on the row just below the tab, starting with “> A”
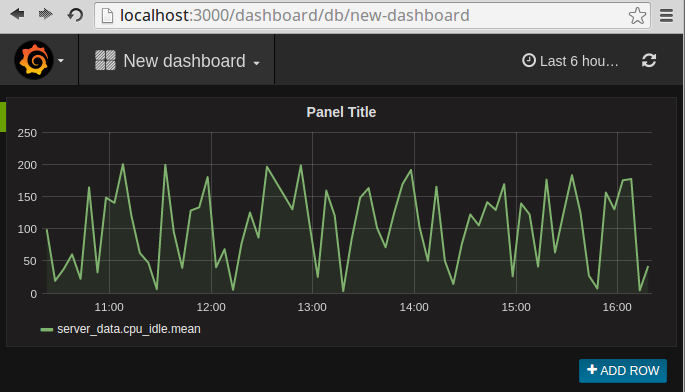
- Click on “select measurement” and select “server_data.cpu_idle”
- You should now see a chart
- Close this, by clicking on the cross, top right hand corner of the Metrics panel
- Save the dashboard
- Click on the save icon (top of the screen)
- Click on the yellow star, next to the dashboard name (“New dashboard”)
- Test it
- In a new browser tab or window, go to http://localhost:3000/
- Log in (admin, admin)
- The “New dashboard” will now show up in the list of starred dashboards (and probably also under “Recently viewed dashboards”)
- Click on “New dashboard” to see the chart
You should now see something like this: